

How Is The Downtown Toronto Rental Market?
I suppose I spoiled the ending, didn’t I?
The rental market is no longer “tough,” I said.
But maybe it depends on who you ask, what you read, and where?
“Weak Condo Market In Downtown Toronto Leads To Dip In Rental Rates, Increased Vacancy”
Globe & Mail
February 7th, 2024
That headline definitely jives with what I saw and felt over the past three months, and you’ll see this shortly in the Q1 rental stats.
But I also noted this headline:
“It’s Never Been Harder To Rent In Canada – Vacancy Rates Fall To 35-Year Low”
RBC Special Reports
February 1st, 2024
Of course, that headline refers to Canada as opposed to Toronto, and it’s looking longer-term, but I think the point is clear: the headlines are never the same.
No matter the market, there will always be two news sources telling different stories.
From the article above:
Acute supply-demand imbalances have pushed the national rental vacancy rate to 1.5% – the lowest point since at least 1988, according to the latest Canada Mortgage and Housing Corp.’s (CMHC) rental market report.
Edmonton and Calgary reported the sharpest drops among Canada’s six major census metropolitan areas (CMAs) last year – due, in part, to the substantial inflow of interprovincial migrants to the province which kept demand for rental housing robust. Calgary now rivals Toronto as the second tightest major rental market in the country. Though the rental vacancy rate in Edmonton is still the highest of the six major markets, a drop to 2.4% indicates that even this city is suffering from a rental supply shortage.
Vancouver’s rental vacancy rate continues to sit below sub-1%, making it the tightest (and most expensive) market in Canada. But tight conditions have spread beyond urban boundaries. Belleville is now the only CMA in Canada with a vacancy rate at or above the optimal 3% rate, which indicates a balance in the market.
Belleville, eh?
I hear it’s nice this time of year!
But let me borrow a chart from the RBC Special Housing Report just to flush out that thought:
Again, this is Canada-wide, and we want to know about Toronto, for our purposes.
For now.
I mean, it’s not unreasonable to assume that I pack up my family and start the YRB, er, um, Yukon Realty Blog.
I’m not sure if I’d be welcome up there, however. We all remember what happened in 2022.
Here in Toronto, we witnessed a very weak first quarter in the rental market.
At one point, poor Tara had seven rental listings on her plate!
The irony is: some of these rental listings had no showings and no offers and other rental listings had too many showings and too many offers.
What do I mean by that?
Well, since I don’t want to be accused of rental discrimination, let me tell you about a hypothetical situation about a guy I know, who knows antother gal, who is the one actually telling this story.
Let’s say that you had a rental listing for a basement apartment in North York, and while it was really nice “for a basement,” it was still just a basement. But because of the price point and the size, it attracted many suitors.
What’s the problem with that, you’re asking?
Well, let’s say that this was a 2-bedroom, 1-bathroom condo. Now, let’s say – again, hypothetically, that every appliation was for eight people who wanted to crowd into the basement like they were worms under a rock. And let’s also say that six of the eight people were unemployed.
Yeah, that sort of situation. Hypothetically.
Of course, there’s a movement out there in society today to simply do away with the rights of a home-owner and for one to be forced to rent to anybody, anywhere, no matter what, and if/when the rent isn’t paid, to simply shut up and eat it – “because you can afford it!”
Rabbit hole. Avoid.
Breathe.
Digress…
We have a client who would rather keep his or her property vacant than “rent to the wrong people,” and thus the property has now been on the market for three months.
We had a rental listing that was reduced in price twice.
We had three rental listings take over one month to lease.
And all the while, I’m thinking, “Isn’t this supposed to be the hottest rental market on earth?”
Maybe we’re just spoiled.
Maybe we’ve grown so accustomed to listing a condo for lease, receving six offers in the first forty-eight hours, and having applicants offer a full year’s rent up front?
In any event, the Q1 rental stats proved that what we were “feeling” out there was real. Let’s have a look…
First, let’s look at new condominium listings in C01 & C01, aka “downtown” in January, February, and March:
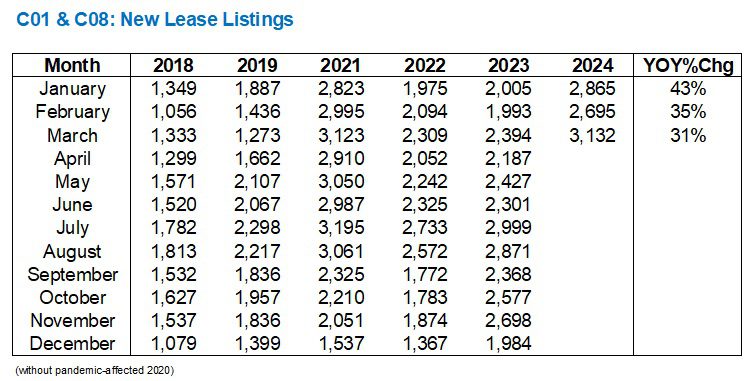
Those are substantial increases!
To see a 43% year-over-year increase right out of the gate in January speaks volumes about the rental market right now.
And while the year-over-year increases in February and March were lower, the overall volume in March actually set a new record, beating out 2021 by a hair.
You can clearly see this in the graph below:
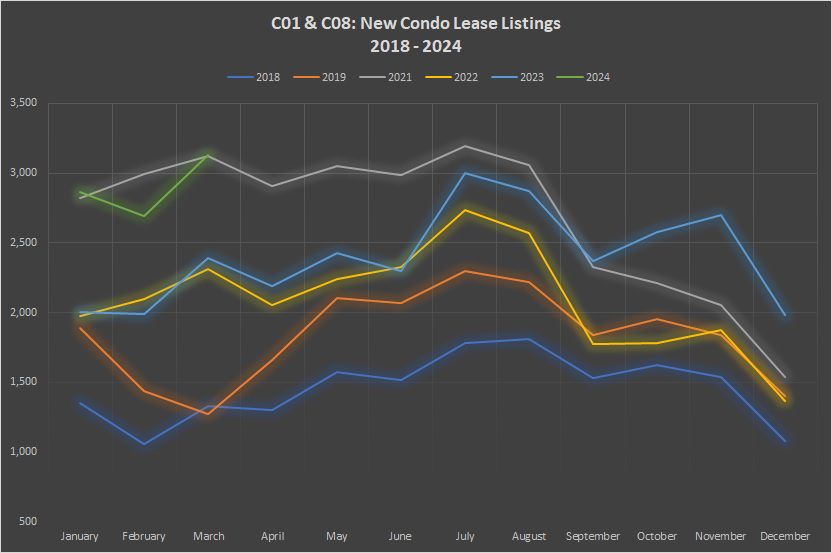
We went from a record-high in January to a slight dip in February, then back to a record in March.
Comparing 2024 to 2018, 2019, 2022, and 2023, it seems as though 2024 and 2021 were in their own league. At least as far as Q1 goes. The 2022 rental market caught up to 2021 by the summer, then surpassed it in the fall.
Note that in four of the last five years, listings have declined from March to April.
2019 was the lone exception.
Without putting too much emphasis on this one stat, I will certainly be on the lookout for the increase/decrease in listings next month. If listings do increase, then it could be a sign of a shift in the rental market.
As for properties leased, the trend was similar but not on par:

Year-over-year, we saw increases in units leased for January, February, and March.
But 23%, 25%, and 19% are well below the 43%, 35%, and 31% respective year-over-year increases in listings.
If we look at this on a chart, without my preceeding commentary, it might seem as though the market is healthy and perhaps doing exceptionally well:

But those are absolute numbers.
January, February, and March – as evidenced by the green line above, are second only to the same period in 2021 for units leased.
But on a relative basis, the market showed weakness.
The relationship between listings and units leased tells us how much competition there will be for rentals.
This is our “absorption rate” or the “sales to new listings ratio,” which we are accustomed to using in all of our market analysis for the resale market, but this can also give us a picture of the relationship between supply and demand in the rental market.
Here’s how Q1 looked in that regard:

The absorption rate of 52% in January is well behind the 61%, 74%, 61%, and 61% rates posted in four of the last five years, and only slightly ahead of the 51% figure from January of 2019.
And while you woudl ordinarily conclude than an absorption rate of 71%, ie. the rate from March, signals “seller’s market,” this is well below the 90%, 110%, 86%, 85%, and 78% rates posted in March of the prior five years.
That figure to me is shocking.
And graphically, it really drives the point home:
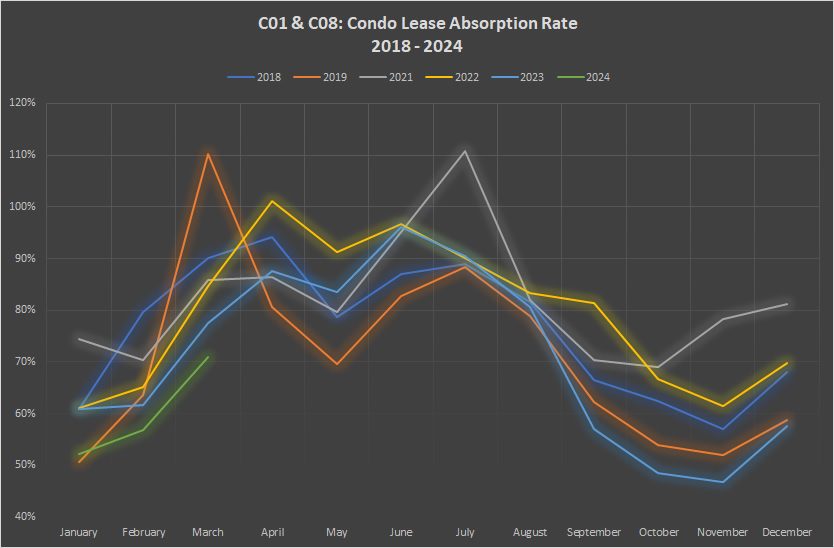
“Thin Red Line” might have been an underapreciated and under-awarded late-90’s war movie, but the thin green line shows that the rental market, statistically speaking, was as weak as it’s been in in February and March since at least 2017.
This data wasn’t enough for me, however.
So I went searching for something else to confirm both my feeling as well as the data above.
I decided to look at how condos were being leased. Not the number of listings, nor the absorption rate, but rather how many were being leased for under the list price, at the list price, or over the list price.
This required the copy-and-paste of a stupid amount of data, since TRREB got rid of its “export” tool some time around 2005 or 2006. Sidebar: we had a new team member start with us this week, and while watching me copy-and-paste, she asked, “Why can’t you just export that?” I told her that TRREB doesn’t give us the tools that we need or want, and she said, “But doesn’t TRREB work for you?”
And it was only her third day…
Alright, so let’s look at all the condos leased in C01 and C08 in January and see:
a) How many were leased below the list price?
b) How many were leased at the list price?
c) How many were leased above the list price?
And in order for this to be useful, we need to compare this data to 2023.
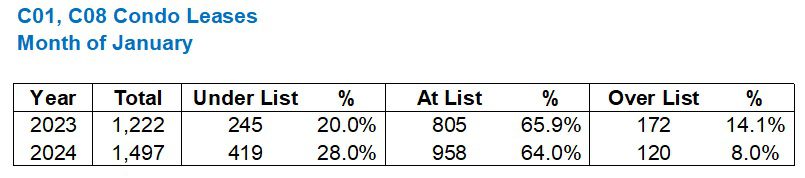
As the kids say, “That tracks.”
The percentage of units being leased under the list price went UP, and the percentage of units weing leased above the list price went DOWN.
The percentage of units being leased at the list price was a nominal difference, but there are still fewer in 2024 than in 2023.
Now, just to support this data even further, I decided to waste another fourteen minutes of my life and look at February as well…

Fewer properties being leased under list and more being leased over list – compared to January. But overall, still well, well behind 2023.
No, I didn’t do March. But I also didn’t use those new-found fourteen minutes to meditate, even though I promised myself in January that I would start doing it daily. To answer the question you now have in your head: once. I’ve done it once.
Tricky rental market so far this year, isn’t it?
If you’re trying to rent your property, or did so over the past three months, we would love to hear your stories!