

March TRREB Stats: Ascending The Mountain
Here’s something that I will happily divulge, at the risk of people who are too sensitive or unrealistic attempting to paint this as inappropriate…
The TRG Team meets every Monday at 9:30am for our weekly meeting, and among the various topics of discussion are the “offer nights” that typically take place on Monday or Tuesday.
As to why we usually set offer dates for Monday or Tuesday, you can read more about that in a blog post that I wrote last month: “When Should You Move Your Offer Date?”
Now, while discussing our upcoming listings, active listings, and offer nights, we often play a prediction game.
Yes, a prediction game.
How many offers?
What’s the sale price?
It’s quite simple.
Personally, I think it’s pretty tame.
But I guess from the files of, “Never underestimate today’s whiner from finding something wrong with everything,” I just picture some message board or chat room where people complain, “Look at these asshole real estate agents – taking bets on how much money they can extract from poor home-buyers!”
Hmm. Maybe now it’s me that’s sensitive. Then again, nothing surprises me anymore…
This prediction game has always served as a training exercise for myself and my agents. We track every possible metric when listing properties; not just the number of showings, but the number of inquiries from agents, the number of requests for the home inspection (for a house) or status certificate (for a condo), and we aim to evaluate our listing and pricing strategies accordingly.
For those on the team who aren’t at the office through the night (usually offers end at 10pm), they’ll come into the office the next morning and look at the board to see who’s prediction was successful.
Now, we don’t just make predictions for offer nights.
In fact, we make predictions for many real estate events!
Monday was April 1st.
That’s not significant because it was Easter Monday, nor because it was April Fool’s day, but rather because April 1st would lead to April 2nd, then April 2nd would lead to April 3rd, and that is when the TRREB stats are typically released for the prior month.
So, a game, then?
With the February average TRREB sale price coming in at $1,108,720 I asked the team:
Where will the March average home price check in?
I thought I had nailed it.
$1,132,724.
That was my prediction.
Chris was too low, Jonathan was too high, and Matthew was floating around out there in no-man’s land.
But maybe I underestimated Tara?
No, not maybe. Definitely…
Bob Barker would be so proud of this!
Tara would win both prize-sets in the “Showcase Showdown.”
But for now, I’ll just chalk it up to luck, and continue being overly competitive…
So the cat’s out of the bag, but hopefully in a fun way!
The average home price in the GTA increased by 1.3%, month-over-month, and that’s after the ridiculous 8.0% increase from January-to-February.
Far-removed from 2021, let’s look at our monthly chart as it stands over the last two-years-and-change:

An optimist would suggest, “The lows of November through January are now in the rear-view mirror.”
A pessimist would say, “There’s a long way to go, in order to get back to the 2023 high, let alone the all-time high in February of 2022.”
I might suggest that we consider the best and worst-case scenarios, if that’s fair?
Talk of a recession dominated 2023, with most people suggesting that it would come in 2024, along with real estate armageddon from all these mortgage holders who were bound to default.
But that didn’t happen last year, and it doesn’t seem to be happening this year as well.
The average home price in March on a year-over-year basis was up 1.3%.
That’s after a February that saw a year-over-year increase of 1.2%.
So whether we’re expecting an increase over 2023 or whether we’re simply keeping pace, let’s not forget that historically best months in the real estate calendar are just ahead.
Now, how does last month’s action compare historically?
In what has become one of my favourite charts, I want to look at the typical February-to-March movement and see how it stacks up against last month’s 1.2% increase in average home price:

This, I did not expect!
Mind you, I started in real estate in 2004, so I can’t quite recall why the average home price would have declined from February to March, for five straight years.
But I would have almost bet that the average home price would increase from February to March every year!
Some items of note that need explaining above:
2017 was that incredible bull run that saw prices peak in April, so that 4.6% increase makes sense.
2020 was the pandemic. Enough said.
2021 was a bull run that few remember, as most still think about 2022. That 5.0% increase stands as the record.
2022 was that biggest ever 2-3 month bull run, and while the peak felt like it was through March, statistically, it was February.
That brings us to the last two years where we see the similarity in the market movement.
Now, despite the increase in month-over-month home prices, the sales data is downright shocking.
There were 6,560 sales in March.
For context, this is lower than March of 2023! And that says something, considering the entire year – 2023, saw the fewest sales this millennium.
So where do those 6,560 sales in March rank all-time?
Yikes…

Second-fewest!
Suddenly, I’m having flashbacks to 2023. This was the story, every month, if you can remember!
And for more context, those newer to the market can’t possibly imagine what March of 2021 was like. Cynics will point to all-time-low interest rates, but I personally think that the societal fallout from the pandemic was a larger driver.
When we get to inventory, perhaps we see the other side of this tale.
I constantly lament that “there’s nothing out there.” I, along with every other agent in the city, are on the lookout for new listings for our buyers, of which none ever seem to materialize.
We saw only 13,120 new listings in March, which also ranks near the bottom when you consider the history:
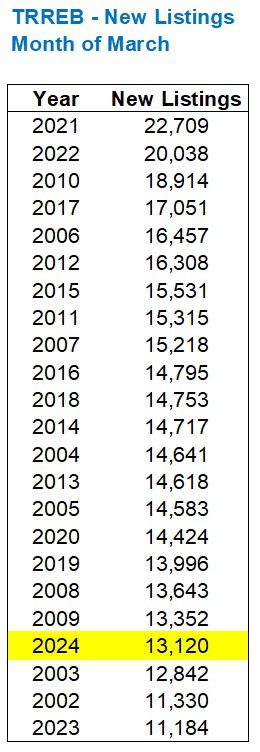
Sure, it’s the fourth-lowest and sales were at the second-lowest level, but you get the idea.
Sales aren’t low because buyers don’t want to buy.
Sales are low because inventory is low.
There were almost ten-thousand more listings in March back in 2021 than this past month!
I would argue that there’s more of a dearth of inventory in the freehold market than in the condo market, and I would challenge another agent or buyer to argue the opposite.
As for breaking down TRREB’s districts and looking at pricing, four of the “Big Five” saw month-over-month increases, which collectively (along with the other, smaller districts) made up that 1.2% month-over-month increase:
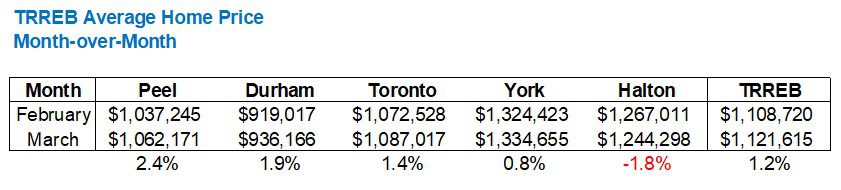
Peel Region was rather surprising to see at the head of the pack considering the year-to-date figures, which I’ll show you next.
But Toronto added another 1.4%, and that’s on top of the 11.7% increase last month.
York Region slowed down, Durham picked up, and Halton actually saw a decline.
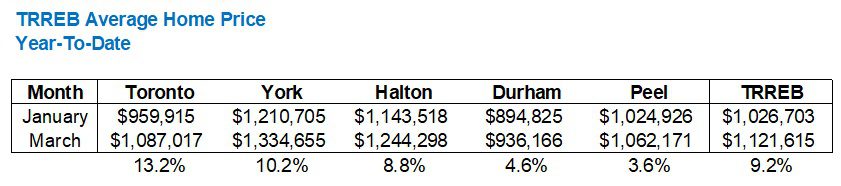
Year-to-date, all five districts are up, but Toronto’s 13.2% is carrying TRREB’s 9.2% average:
So what’s next?
Well, we have the month of April, which has zero holidays or breaks, unlike March which was broken up by public school spring breaks, private school spring breaks, and then Good Friday & Easter.
April is typically a very strong month in the market.
If I were a betting man, I would expect the average GTA home price to add another 2-3%.
That would put the average between $1,144,000 – $1,155,000 by the end of April.
Looking at how prices move from March to April historically, I found some very, very interesting data points…
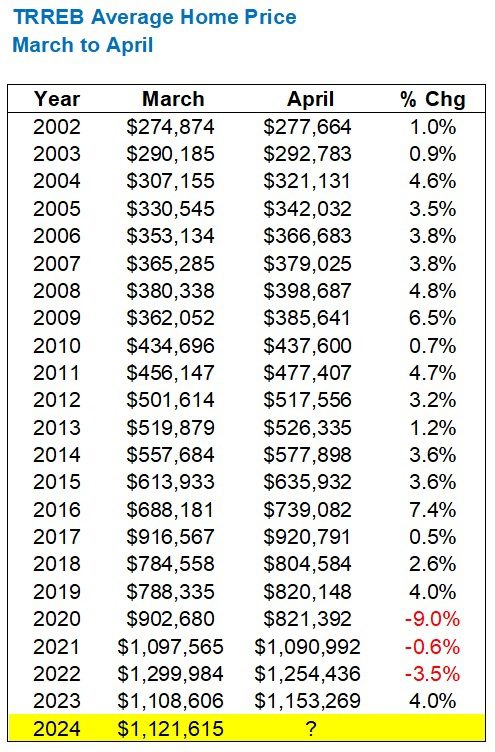
Well, you don’t see that every day!
Eighteen straight years of month-over-month increases, followed by three straight years of decline.
Then a 4.0% increase last year?
Huh?
Speak into my good ear, please. I have no idea what to make of this.
If you were told, “The average home price has increased from March to April in nineteen of the past twenty-two years,” you’d like wager that we’ll see an increase next month.
But if you were told that in three of the last four years, we saw a decline, perhaps you wouldn’t be so certain.
I’ll stick by my prediction of a 2-3% increase.
As I write this blog post on Wednesday night, we just sold a condo townhouse by accepting a bully offer, and the price was more than the same unit just sold for last month – with that unit in debatably better condition. That is the sign of a market that’s on the ascent. Or, maybe we’re just really good agents and our staging was kick-ass. You decide.
Either way, through three days in April I can already see a massive uptick in inventory.
And if you think that buyers aren’t out there, just look at the $4.6 Million house in South Leaside that was listed yesterday – and sold in multiple offers tonight. When there’s record-setting sales, in competition, in that price point, it’s hard to be bearish.
Is it not?