

May TRREB Stats: The Calm Before The Storm?
Hang on a second – I’m getting an email.
And a text message.
Two text messages, in fact. Now three. Now four. Now another email. And another.
What just happened? Is the world on fire?
Nope.
We just saw the first interest rate cut by the Bank of Canada in four years.
And while I, like many others, was waiting to see what the Bank of Canada would do, I surely underestimated the response that an interest rate cut would illicit!
Starting at 9:45am (and a few seconds) on Wednesday morning, my phone began to light up. Phone calls, text messages, emails, and even a carrier pigeon with a note flew up to my window. Sadly, he flew into the glass and perished, but the note read, “What sayeth as to thou lender?”
But seriously, we will have lots of time to talk about interest rates. In fact, that might be a post for next week.
Today, I want to go over the May TRREB stats, which ironically were released the same morning that the Bank of Canada made their announcement.
Coincidence?
Or proof that God exists and she has a wicked sense of irony?
The interesting thing is: these stats are not “good.”
As you undoubtedly concluded after reading this feature in April, most of the real estate indicators would lead us to be bearish.
But as I concluded at the end of April’s post: maybe it doesn’t matter anymore?
For the last couple of months, I have been asking this question:
Will the average home price in May top the mark of $1,196,101 set in May of 2023?
That was the 2023 peak, and with upward momentum on price so far in 2024, it wasn’t impossible.
We saw the average home price increase from January to February, February to March, and March to April.
We also saw year-over-year increased in average home price in February, March, and April.
So then, did we see the average home price increase in May?
No.
It declined by 2.5%.
But month-over-month, it rose a modest 0.8%:
From $1,156,167 to $1,165,691 on a month-over-month basis, indicating a rising market.
But down from $1,196,101 year-over-year.
Personally, I expected to see that figure near the 2023 mark. I would have said, “Okay, sure, I guess,” if the mark was over $1,180,000, but to see it only top $1,165,000 was surprising.
May was very busy.
Prices did rise in May.
I had some absolutely outrageous “offer nights” on my listings, and to see an increase of 0.8% from last month doesn’t make any sense.
However, as I’ll show you shortly, there are different averages within that average. Stay tuned…
First, I want to answer the question, “Should we expect to see an increase in average home price from April to May?”
Yes.
According to this:
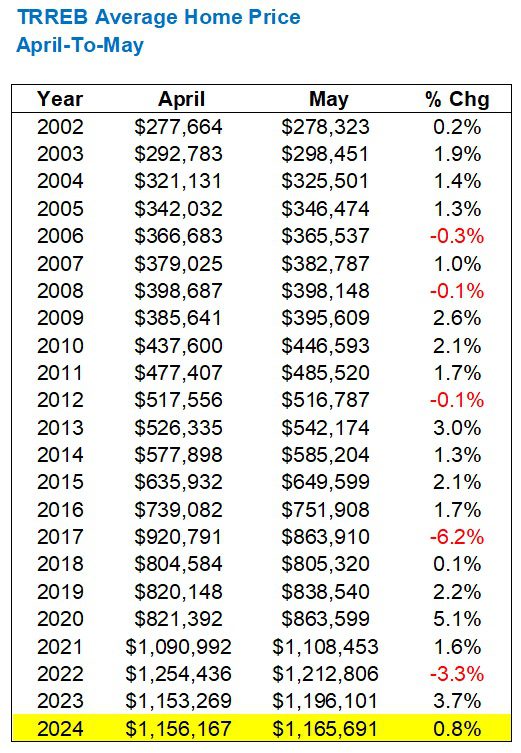
Only five times in the previous twenty-two years did we see a decline from April to May, and three were in periods of major decline: 2008, 2017, and 2022.
This, as the kids say, “tracks.”
Now, back to this idea that the 0.8% increase, month-over-month, felt “light.”
Since I generally work in the 416, my stories and my feelings are based within.
So what happens when we split that 0.8% TRREB average into five different averages in the five major TRREB districts?
Well, it looks like this:
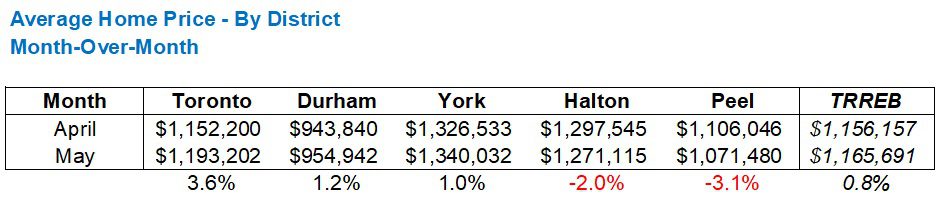
Toronto was up 3.6% from April to May, which “feels” more in line with the market than the 0.8% TRREB average.
In fact, the decline in average home price in Halton and Peel are what’s dragging that 0.8% increase down.
The TRREB average home price needed to increase by 3.5% from April in order to surpass the peak of $1,196,101 from May of 2023, and while the Toronto(416) average met the measure, none of the other four TRREB districts did.
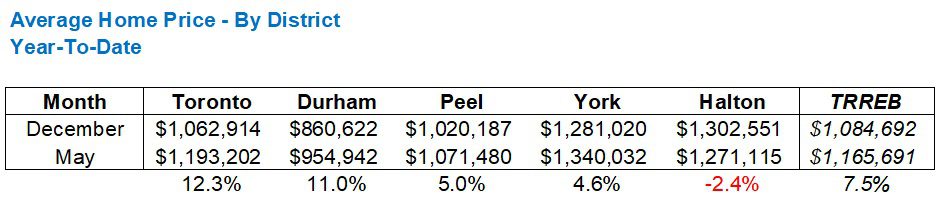
Just to play catch-up, here’s the year-to-date data for the five major TRREB regions:
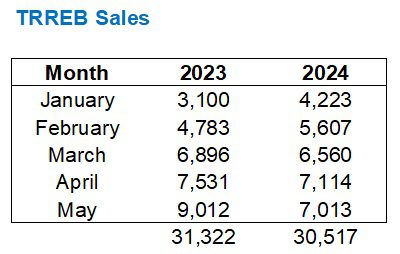
Now let’s talk about sales.
Yikes.
Recall that in the month of April, we saw the fewest sales in any month of April this millennium, outside of the 2020-pandemic.
Well, the May sales weren’t a whole lot better…

Alright, so this is pretty bad, right?
Awful market metrics and indicative of a declining market?
Theoretically, yes. But then how come prices aren’t plummeting?
And consider something else:
We saw the fewest sales in 2023 that we’ve seen since the 1990’s.
Recall this chart from previous blogs:
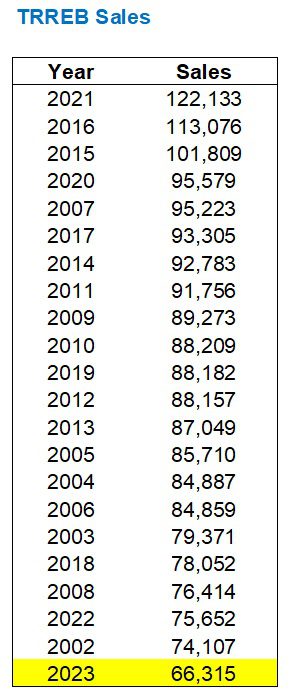
Well, guess what?
Through five months in 2024, we’re actually behind last year’s pace:
Again, I will ask: aren’t these bearish indicators?
Sure!
But the market hasn’t declined. It’s continuing to go up.
When it comes to new listings, we’re not seeing anything too crazy when we compare against previous years:
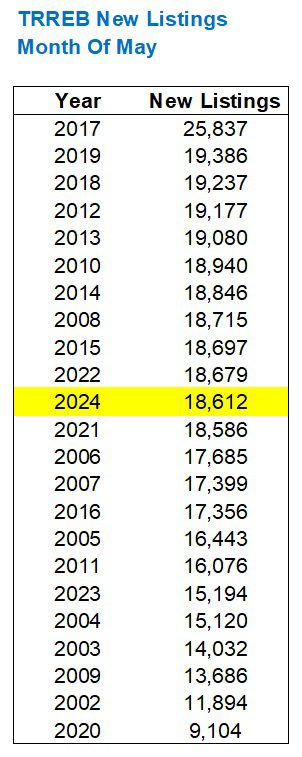
Middle of the pack. Right?
But…….but….
Oh boy, here’s the thing!
The number of listings may or may not matter; it depends on perspective. And in my mind, there could be one million listings and I wouldn’t think that’s a problem so long as there are 500,000 or more sales.
Do you catch my drift?
Seeing 18,612 new listings in the month of May doesn’t look like that many, given it’s middle of the pack in the chart above, but consider that we just saw the fewest sales in any month of April.
Simple math here:
7,013 Sales
18,612 New Listings
= 37.7% absorption rate
That’s quite poor.
In fact, it’s the poorest ever in the month of May:
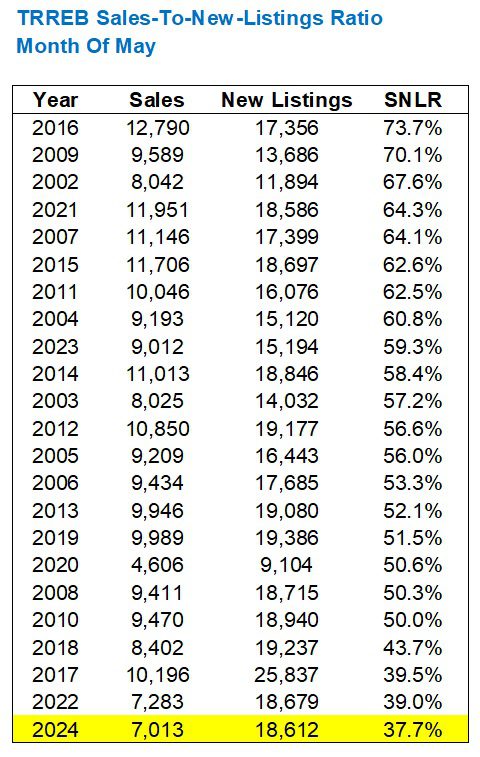
It’s worse than during the pandemic in 2020.
It’s worse than the manufactured-decline in 2022.
An absorption rate of 37.7% screams “buyer’s market,” and yet prices increased.
Year-to-date, the SNLR has been steadily dropping:
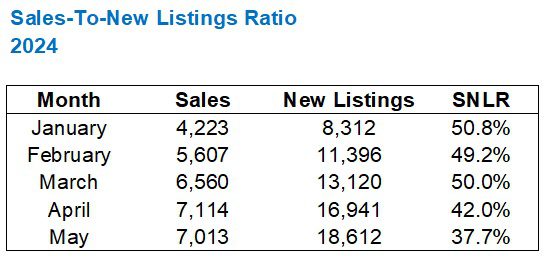
What started as a balanced market (in theory) has now led to a buyer’s market (in theory).
Only in practice, we’re still seeing a seller’s market.
I’m still pricing my freehold listings for multiple offers and getting them.
And while prices aren’t as high as in February of 2022 (they are in some areas), they’re certainly higher than this time last year.
It’s just that the TRREB average home price doesn’t show it.
Am I projecting a wee too bit here?
I mean, I’m being honest. I’m showing you negative market data, or at least data that seems negative.
But this feels like a case of something walking like a duck and quacking like a duck, but not actually being a duck.
Sales are at all-time low levels. But prices aren’t just holding; they’re increasing.
That does not conform with the laws of supply and demand that we great up studying, and yet there’s no other conclusion to draw except this: the Toronto market is resilient.
Okay, fine, now maybe I’m projecting too much.
But if any of you have another conclusion, explanation, or view, please share.
Just don’t forget to mention how you think a 75-basis-point cut by the end of 2024 is going to affect the market in June, into the fall, and beyond…